
Data and Statistics in early childhood
From mobile phone usage to housing price changes, weather forecast graphs to voting trends, data is generated and presented to us daily. Data can be really useful and help us make decisions. Sometimes it can be overwhelming, especially if we are unsure about what it means and how it impacts our lives. These all sound like very adult-related concepts and challenges. So is it important to consider the generation and analysis of data in early childhood? This article looks at how we might start thinking about a learning journey in data and statistics...
In an age increasingly driven by data, what do we need think about?


At first glance, this graph seems to make sense. Now take a second look - is there something that is not quite right?
This is one of our favourite examples from an Australian newspaper in the lead up to a Federal election of a new Prime Minister. If you look at the colour green, which is indicated as YES you would think it was a certainty. But then you notice 10% and realise that most of the graph is green, the totals don't match the percentages... You have been using your statistical literacy to discern if the the story presented by this graph is accurate and fair.
The foundations of these statistical literacy skills start back in early childhood as we develop children's abilities to understand, gather and use data.
They involve:
-
Sorting and matching, and classifying
-
Collecting, organising, representing, interpreting and communicating data
The simple and independent act of sorting washing into baskets that belong to Jack or Emma, is well along the learning journey that can lead to a conceptual understanding of how and why we use data effectively.
So what do we need to think about and what learning opportunities can we provide?
First, some important mathematical background knoweldge
As educators we need to intentionally use appropriate mathematical terms. Here are some we will need to consider, observe and model in relation to Data and Statistics (the underlined ones direct you to more explanation on another page)
1: 1 correspondence - assigning one distinct number name (one, two, three…etc) to one object only, in the set of things being counted.
Sorting and classifying - Sorting is the action. When you sort objects or ideas you put them together.Classifying tells us the big overarching idea or concept. It could be considered the sorting rule. Comparisons that require children to focus in on different attributes and features leads well into sorting and classifying.
Categorical data
Values sorted according to distinct groups, e.g. shoes sorted according to colour
These categories can still be numbers, e.g. postcodes 2102, 2011.
Numerical data
Information expressed as numbers and obtained by counting (discrete) e.g. the number of kittens in a litter or measuring (continuous) e.g.temperature.


Picture graph
A simple presentation of data collected with a concrete relationship between the information collected and how it is organised. This can be with the actual objects (like the fruit graph) or with children's representations of them. These are generally in a 1:1 display in the early years. Labelling of the graph (title, axes) is gradually introduced.


Column graph
Information is represented in column form. Columns in these graphs can be horizontal or vertical. Using this kind of graph reinforces the importance of a common baseline so we can accurately compare the information presented.
You can see in the 2D shapes column graph there is a common baseline - all the columns sit on the same line. However, the 2D shapes are not the same height which makes it tricky to accurately compare the quantities without continuously counting them.
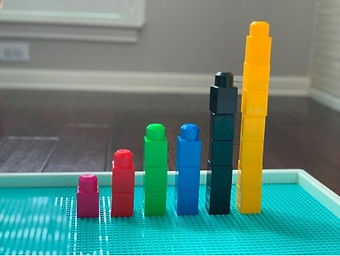
The unifix blocks stacked in the second column graph have the same baseline and are also a consistent size so when we stack them, we can accurately compare them in terms of more than, less than, same as. It also allows us to put a numerical scale on the vertical axes, broadening our opportunities to make comparisons.

Precursor concepts
Before very young children begin to develop their conceptual understanding about more formal mathematics like Data and Statistics, they are practising and developing the pre-cursor concepts of Attribute, Comparison, Pattern, and Change (Erikson, nd).
A summary of these concepts and associated skills can be seen below. For more detail see our Precursor Concepts page.

Precursor concepts can be thought of as the initial skills that children explore from the moment they are born. They develop over time with exposure to different experiences, materials, and contexts.
It is interesting, then, to consider the kinds of experiences we need can plan for and build on to develop a deeper understanding of how to gather and use data.
Learning Trajectories can be helpful
The following Classification and Data learning trajectory (LT) is based on the work of Doug Clements and Julie Sarama (2019). Like all trajectories, it offers possibilities in terms of the observable behaviours you may see at particular times in a child's development. They are not intended as lock-step and prescriptive. Quite often there will be overlaps in what children are doing and saying across these levels, meaning that the attention we pay and the responses we make accordingly need to also be flexible and intentional.
Looking at these summaries of the Classification and Data LTs from birth - 6 years, we can see the age ranges, corresponding trajectory levels and observable behaviours, and possible learning opportunities (including thinking prompts) we might provide.


Summary of research and trajectory detail from Clements, D. H., & Sarama, J.(2017/2019). Learning and teaching with learning trajectories [LT]2.Retrieved from Marsico Institute, Morgridge College of Education, University of Denver.
E
As you can see, looking for and noticing similarities and differences is an important part of the learning opportunities for children up to 2 years old. In this time, we are encouraging children to focus on different attributes of everyday objects and experiences. This focus aligns with the skills related to the development of the precursor concepts Attribute and Comparison.
Let's walk around the garden!
Walking in Australian gardens at different times of the year promotes a range of experiences related to texture, shape, mass, colour etc.
After noticing these attributes we may decide to collect some and model the sorting process - looking for objects that have something the same about them into a set.
For example:
"Let's sort what we found on our walk outside"
"Let's put together the things that are similar or alike. We could put the gum nuts together because they are the same."
As the child becomes more active in the sorting, label and narrate what they are doing. For example:
" I can see you are putting all the ___ together over here and all the _____ together over there."
"I agree that all these leaves are similar, they are all _____"


As children become older they become more confident to sort and classify themselves. Our guidance is still needed in relation to the actions they are taking but may not be able to verbalise well. Asking 3 and 4 year olds to tell you about their sorting into sets will promote important language they will refer to later when comparing the results of their data sets.

By the time children are between 4 and 6, they are giving cases (groups of objects) a numerical value and using this to analyse their data.

Summary of research and trajectory detail from Clements, D. H., & Sarama, J.(2017/2019). Learning and teaching with learning trajectories [LT]2.Retrieved from Marsico Institute, Morgridge College of Education, University of Denver.
PCRAI cycle
The PCRAI cycle (Montague-Smith & Price, 2012) is a helpful structure for thinking about the design and implementation of investigations that involve data.
This process starts by working from the interests and world of the child. Before the process starts, then, we need to know what they are interested in and think about how we might find out. Next we want to know what questions they have... and the process starts.
We will write about this cycle, with examples in our new provocations blog about Pets (coming soon).

Early Years Learning Framework 2.0
Considering the learning trajectory above, it is interesting to look a the place of generating, representing and discussing data viewed through the EYLF2.0 (AGDE, 2022). We know there are general problem solving processes in the EYLF2.0 which promote a range of learning and thinking skills. These are often transferable to mathematics problem solving situations. There are also outcomes which specifically mention mathematics or appear to be associated with mathematics concepts based on aligned educator-implementation advice. Those that appear to refer to data and statistical literacy include:
Learning Outcome 4: Children are confident and involved learners
KC 2: Children develop a range of learning and thinking skills and processes such as problem solving, inquiry, experimentation, hypothesising, researching and investigating
Evident when children:
-
create and use representation to organise, record and communicate mathematical ideas and concepts
Learning Outcome 5: Children are effective communicators
KC4: Children begin to understand how symbols and pattern systems work
Evident when children:
-
begin to sort, categorise, order and compare collections and events and attributes of objects and materials in their social and natural worlds
The 2022 EYLF glossary has composite definition of mathematics and numeracy that highlights the importance of a practical understanding of data:
Mathematics and numeracy: broadly includes understandings about numbers, patterns, measurement, time, spatial awareness and chance, and data, as well as mathematical thinking, reasoning and counting
Australian Curriculum: Mathematics V9
If we consider the early years of formal schooling, the Australian Curriculum: Mathematics (V9) indicates the data and statistics concepts young children are working towards. In their first year, children learn to:
-
collect, sort and compare data represented by objects and images in response to given investigative questions that relate to familiar situations (AC9MFST01)
This outcome promotes experiences that involve sorting and classifying; collecting and deciding how to organise data displays; representing, comparing and interpreting data.
In their second year of school children learn to:
-
acquire and record data for categorical variables in various ways including using digital tools objects, images, drawings, lists, tally marks and symbols, and
-
represent collected data for a categorical variable using 1:1 displays and digital tools where appropriate; compare the data using frequencies and discuss the findings (AC9M1ST01)
These outcomes promote experiences that involve discussing how to collect data based on the question asked; creating questions based on data collected; using tally marks.
Emphasised in both these outcomes is collecting and recording data related to topics of children's interest and naturally-related contexts.
References
Australian Department of Education. (2022). Belonging, being & becoming: The early years learning framework for Australia V2.0. https://www.acecqa.gov.au/sites/default/files/2023-01/EYLF-2022-V2.0.pdf
Clements, D. H., & Sarama, J.(2017/2019). Learning and teaching with learning trajectories [LT]2.Retrieved from Marsico Institute, Morgridge College of Education, University of Denver.
Erikson,(nd) Early Math Collaborative, https://earlymath.erikson.edu/why-early-math-everyday-math/precursor-concepts/
Montague-Smith, Ann et al, ‘Learning Mathematics in Early Years Settings’ in Mathematics in Early Years Education (Routledge, 4th ed, 2018) 1